Bayes’
theorem, also known as
Bayes’
rule or
Bayes’ law named after 18th-century British mathematician Thomas Bayes, is a mathematical formula used to calculate conditional probability. In other words, it is used to calculate the probability of an event based on its association with another event. It incorporates prior knowledge while calculating the probability of occurrence of the same in the future. It is often used in today’s highly demanding Machine Learning and Artificial Intelligence applications and is now one of the most useful concepts for understanding few
Vantage algorithms to predict the probability of an outcome. So, let’s try to understand the theorem in detail.
Bayes’ Theorem is based on Conditional Probability. Let’s discuss how.
Say, there are two events , H(hypothesis) and e(evidence/data) and we need to find the probability of event H occurring given that event e already occurred. Conditional Probability states this as:
P(H|e)=P(H and e) / P(e) , where
P(H and e) denotes intersection of both events
P(e) denotes probability of occurrence of e
So,
P(H|e). P(e) = P(H and e) → say this is equation A
Similarly,
P(e|H).P(H) = P(e and H) → say this is equation B
Now, right hand side of both A and B are same, so
P(H|e). P(e) = P(e|H).P(H)
Hence,
P(H|e) =P(e|H).P(H) / P(e)
This is Bayes’ Theorem, where we have four probabilities as follows:
P(H|e): Posterior probability, dependent on other 3 probabilities.
P(e|H): Likelihood probability
P(H): Prior probability
P(e): Marginal probability
Now let’s discuss this with two simple examples so that you get a clear idea of the implementation of Bayes’ Theorem.
Spinning Wheels
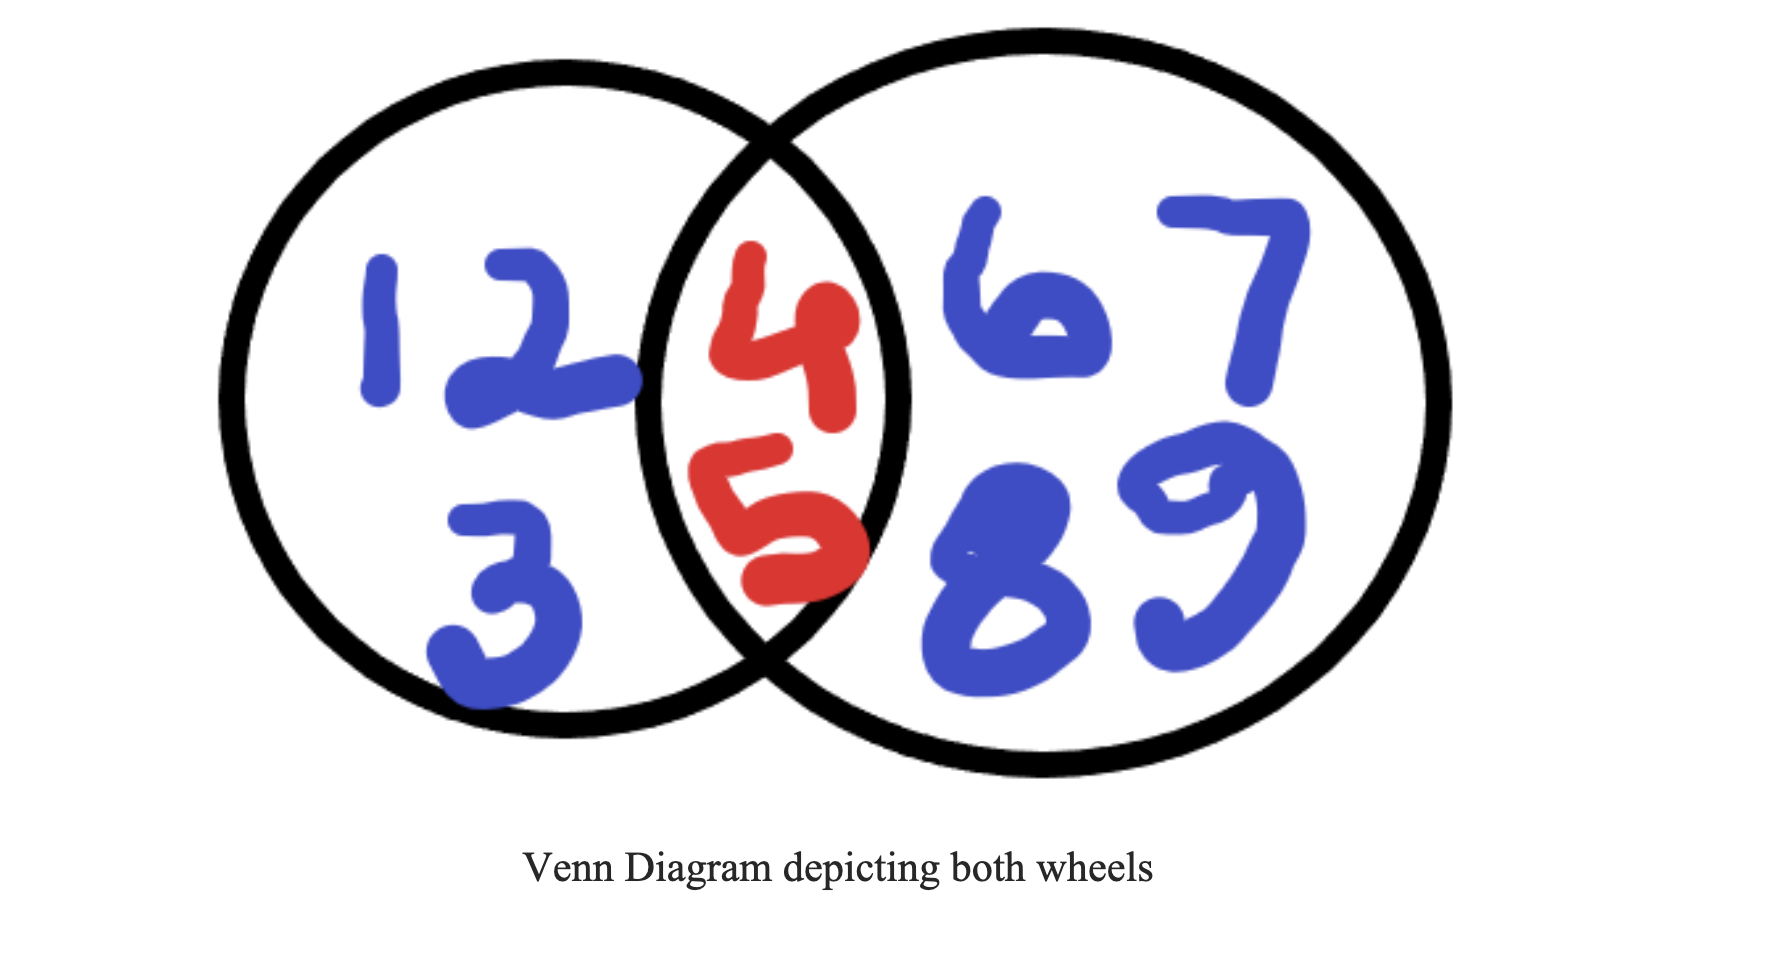
Suppose, we have 2 spinning wheels with numbers {1,2,3,4,5,6,7,8,9} divided between them. The first wheel,
say H, has numbers ≤ 5 whereas the second wheel,
say e, has numbers ≥4. Now if we spin both the wheels, what is the probability of getting a number on the first wheel given that the same number is also obtained from second wheel. Here
H is the hypothesis and
e is the observed evidence.
H= {1,2,3,4,5}
e= {4,5,6,7,8,9}

Probabilities are as follows:
P(H)= 5/9
P(e)=6/9
P(H and e)=2/9
Now, if we see conceptually, P(e|H) is
“how much of e is in H” and H has 5 numbers, out of that 2 are from e which are also from H.
So,
P(e|H) = 2/5
** You can also use probability formulas here to find P(e|H) **
Therefore, coming to Bayes’ Theorem, we have
P(H|e) =P(e|H).P(H) / P(e) = (2/5).(5/9) / (6/9) = 2/6 =1/3
So, the probability of the hypothesis given the observed evidence is
P(H|e)=1/3.
Let’s check using the conditional probability formula as well, so as to verify the result.
P(H|e) = P(H and e) / P(e) = (2/9) / (6/9) = 2/6 = 1/3
This also gives the same result supporting the fact that Bayes Theorem is derived from Conditional Probability.
This is Bayes’ Theorem
COVID-19 cases:
Let us now consider a hypothetical COVID-19 scenario to understand the theorem better.
We all know that COVID-19 is now a worldwide pandemic. All the countries are working hard together to analyze the virus and to find a solution to put an end to this situation. Let’s pray that the solution comes fast and the pandemic ends soon.
Suppose in a
hypothetical COVID-19 clinic we need to find a person’s probability of being ‘COVID-19 positive’ if he/she has dry cough. Here, ‘cough’ is the observed evidence for the hypothesis ‘COVID-19 positive.'
- H would be the event “patient is COVID-19 positive.” The past two weeks of hypothetical data indicate 10% of patients in the clinic have tested positive in such cases. P(H) = 0.10
- e is the event “patient has dry cough.” The past two weeks of hypothetical data indicates 5% of patients in the clinic have dry cough in such cases. P(e) = 0.05
- The clinic’s records also show that of the hypothetical patients that tested positive for COVID-19, only 9% have dry cough. In other words, the probability that a patient has a dry cough, given they have tested positive for COVID-19, is 9%. P(e∣H) =0.09
Now, applying Bayes’ theorem, to find a person’s probability of having tested positive for COVID-19, if they have dry cough:
P(H ∣ e) = (0.09 * 0.10) / (0.05) = 0.18
Hypothetical conclusion: So, if a patient has dry cough, their chance of being tested positive for COVID-19 is 18%. Hence, it’s unlikely that a patient with dry cough in this clinic will test positive for COVID-19.
With the introduction of Vantage’s analytical functions, like Naïve Bayes’, it is now possible to utilize Bayes’ Theorem concepts to predict the outcome of any event. This way we can help our customers analyze and provide solutions to many complex problems and help them plan their actions in advance to meet their future business requirements.
Another, non-hypothetical example is from Teradata’s Timothy Clarke and his presentation during Teradata Universe which showed how the Naïve Bayes approach with Vantage’s Machine Learning Engine helps in deciphering emotion analytics of Twitter users. Below is one such slide from the presentation showing the analysis workflow of the Naïve Bayes algorithm.

Hope this article helped you to understand Bayes’ Theorem in a simple and clearer way. This article is intended to give you a basic understanding of the theorem in a simpler way so that you can understand the Naïve Bayes function while implementing Vantage.
Comments and feedback are most welcome.
Dhruba Barman has been working with Teradata since 2012 in India and is part of Managed Services in Mumbai working as a Performance DBA. His daily tasks involve performance optimization to add value to customer's data which are in the form of jobs and reports. He provides Vantage training within Managed Services and Tech Talk sessions and is working actively on new the Vantage system for his customers, providing different ways of optimizing the new IFX system using the new features of TD16.20. He is interested in learning new technologies and actively participates in Machine Learning Hackathons, both inside and outside Teradata.
View all posts by Dhruba Barman