Over the past few years, there has been a consistent theme to conversations I had when explaining “what Teradata does and why” to analysts, customers or our newer hires. At some point, the conversations always turn to the fact that there is a slew of data and a variety of analytics. The hard part is how do companies make sense of the mess and even embark on a clear path.
During those discussions, I stumbled upon my simple analogy of the circle and the square. This started as a simple “back of the napkin” talk, progressed to the whiteboard, and it has become one of my most requested, and best received, thought pieces. To extend the reach of the message, I thought I would share it in our blogs and trust you will enjoy and learn from it.
“The Circle” – The Universe of Data….
The gist of the idea came from someone asking about best practices in “big data” management. I asked how well they do “little data” management because the paradox is that data management is the same as it always was but you first have to understand that not all data needs the same level of management. This is the birth of the circle.
The circle represents your universe of data, from the outside edge of completely raw data to the inside point of perfectly curated and trusted data. As you move into the middle, the data becomes more used and thus needs more curation, more governance, and more oversight from IT processes. So the big question is “how do you know if the data is in the right spot in your circle?”

The answer is quite simple: your data is in the right part of the spectrum if the cost to get it there, is justified by the value of having it there. If there are just a few data scientists playing around with some sensor data, then there is no need to require a lot of IT oversight and management rigor. Store the raw data cheaply and let them run programs against it to find insight. Once there is an insight then you may need to start joining that sensor data to other data, and now data management has to occur to ensure like data elements are consistent.
But it does not happen all at once. As you move closer to the middle, and find more value, or share with more communities, then you add the next layer of sensible governance.
And by the way, it is not a one-way migration. Some data will have provided high value but now has lower value. That means you may loosen some of the governance over time. This will also help with your prioritization of what data needs to be managed more to drive a wider usage and thus get more value, and the cycle begins anew.
That is the circle part of the discussion, understanding your universe of data and how best to manage the ebb of flow of data around the environment. Now let’s take a look at the square, which represents the world of analytics.
“The Square” - The Analytic Matrix….
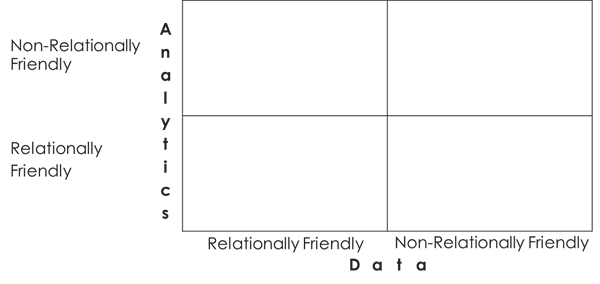
While there is a vast array of complex and involved analytic processes, the square simplifies the discussion. Once a framework for discussion has been established, people can finagle the details but good to get all parties on the same page before going down that path. The square looks at the environment from a two by two matrix. You have the sides of data and analytics and then each is broken loosely into “relationally friendly” and “relationally unfriendly” (yes, these are not technical terms). The point of the square is to understand when to use what type of analytic processing.

What is meant by “relationally friendly”? For the data section it means data that has a well-defined structure, fits nicely into tables with rows and columns, and behaves in a predictable way. For the analytics side, it means analytics which are SQL compatible, can be used with set manipulation techniques, and are generally within the capabilities of business users.
Looking at the matrix (and this is best drawn as you are having the discussion…) we will just go around the squares and understand the ramification of the different data / analytics combinations.
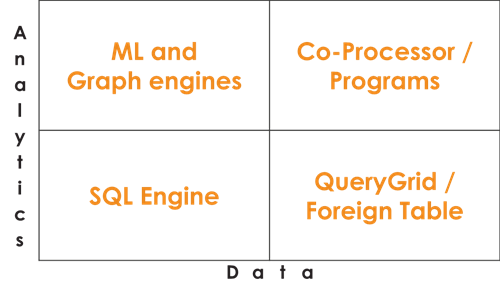
First, lower left. You have relational data with relational analytics. In this case, it shouldn’t come as a surprise that you want a relational SQL database that is built for analytics - the Teradata sweet spot. Our database technology has decades of being the best in class for this type of workloads. The richness and capability here is unmatched by other solutions.
Second, let’s go to the lower right. Here we have data that is not suitable for storing in a relational database, but we still need relational analytics. So the data may be JSON, semi-structured, or un-modeled data and we want to include it in a series of “traditional “queries. For example, maybe there is a web log in JSON structure on external storage and you want it to understand how often certain web pages are visited. For this sector we’d want to have the analytic power of Teradata but the storage of S3, Azure blobs, or Hadoop. Using QueryGrid or the soon available “Foreign Table” (for native object store access), one can write the query without having to know the data is stored on a different platform.
Taking the cross-matrix jump, the next stop is the upper left. Now there is relational data but you need more analytic freedom than simple SQL provides. Here the need is for advanced analytics, machine learning, or even graphing functions BUT the data is still stored in a relational database. Rather than move data around the ecosystem, it is better to have the advanced engines in the environment directly. This is the big evolutionary step that Teradata Vantage brings to the table. Within the platform there is not only the Advanced SQL Engine but Machine Learning and Graph nodes as well.
Lastly, there is the upper right. Here the analytics are in the realm of advanced AI, and the data may be completely unsuitable for SQL, for example, video or audio recordings. Here the need is for accessibility to many data sources with different and highly tuned engines for each process. This will be accomplished with the addition of other analytic engines being introduced to the Vantage platform throughout 2019 and beyond.
When it is all said and done, what you have is the filled out matrix that looks like the picture below:

Integrating Data and Analytics to get Answers
We do not store data and run analytics for fun, there needs to be a business purpose for searching for answers. In order to manage the environment effectively, one must balance the business need with the technical cost. The circle and square discussion is all about how to get the different dimensions under control in a manner that you can respond in a targeted and timely manner.
For example, you may have call center recordings that need specialized analytics but you also want to join that data with your sales and customer information to understand the long term value of the customers that are calling into the call center. Are valuable clients upset? Is there a trend between the type of customer and the frequency or topic of complaints? To answer this quickly, you need to minimize the “move and use” mentality and integrate these analytics into one or few steps
By storing data where it makes sense, and then leveraging the Teradata Vantage analytic platform, the unnecessary and unproductive movement of data is minimized or eliminated in total. In the end this gives all users accessibility to investigate data and get answers. By being able to productionize and deploy at scale, companies have their answers quickly, which makes the difference between “understanding” and “acting” (and hint, the action is what brings more value).
Starting with Teradata in 1987, Rob Armstrong has contributed in virtually every aspect of the data warehouse and analytical processing arenas. Rob’s work in the computer industry has been dedicated to data-driven business improvement and more effective business decisions and execution. Roles have encompassed the design, justification, implementation and evolution of enterprise data warehouses.
In his current role, Rob continues the Teradata tradition of integrating data and enabling end-user access for true self-driven analysis and data-driven actions. Increasingly, he incorporates the world of non-traditional “big data” into the analytical process. He also has expanded the technology environment beyond the on-premises data center to include the world of public and private clouds to create a total analytic ecosystem.
Rob earned a B.A. degree in Management Science with an emphasis in mathematics and relational theory at the University of California, San Diego. He resides and works from San Diego.
View all posts by Rob Armstrong